Extending the causal inference toolkit for ecologists: A visualization method of indirect effects
Allen Bush-Beaupré1, Simon Coroller-Chouraki1, Marc Bélisle1,2
1Université de Sherbrooke, Département de biologie, Sherbrooke, Canada
2Centre d’étude de la forêt (CÉF)
Allen Bush-Beaupré: allen.bush-beaupre@usherbrooke.ca | ORCID: 0000-0001-6989-9278
Simon Coroller-Chouraki: ORCID: 0000-0001-8721-3727
Marc Bélisle: ORCID: 0000-0003-0657-6724
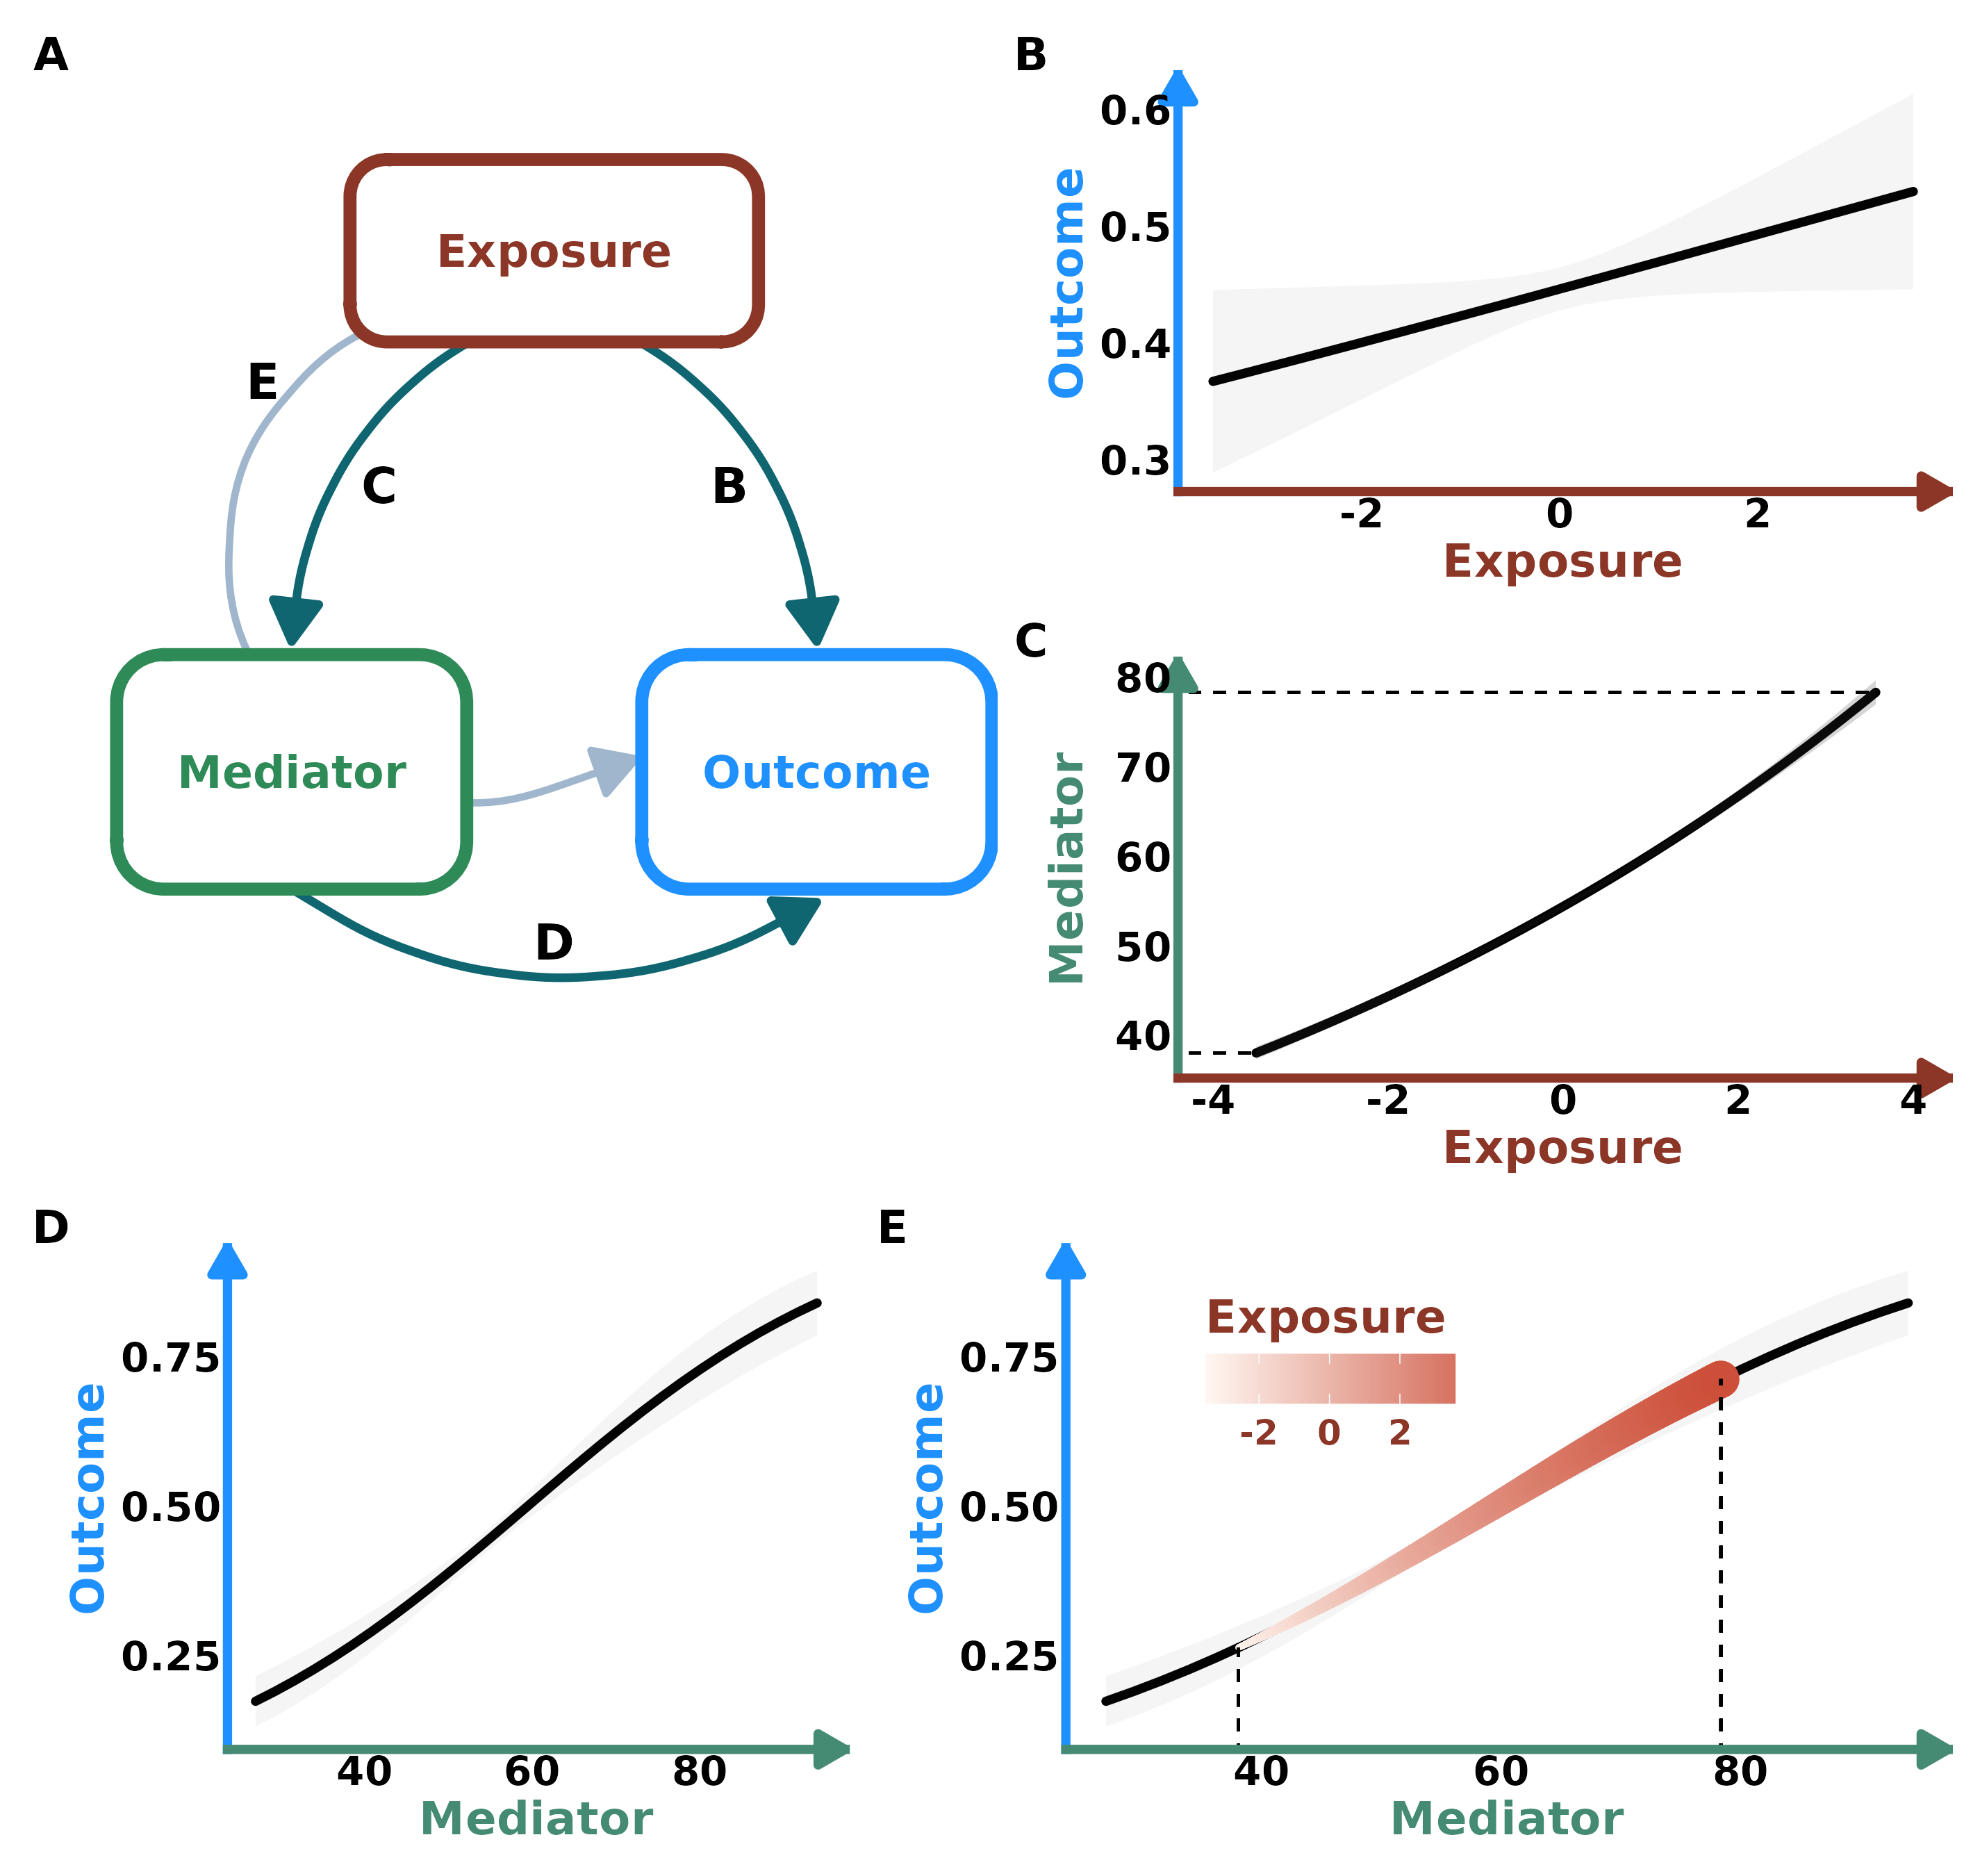
Welcome to the webpage dedicated to visualizing indirect effects for a wide scope of use cases in causal and network analyses. Being ecologists, we have focused on applying the visualization method we developed to examples in ecology. The method can however be applied to all fields of research in which indirect effects are of interest. By leveraging commonly used software such as marginaleffects and ggplot2, our method can be easily integrated into most analysis workflows.
Abstract
Much ecological research focuses on how a given variable can affect another either directly or indirectly through the effect of one or more intervening variables in the context of causal inference and network analyses. Various methods to quantify the magnitude of these effects are available but are difficult to interpret in a meaningful way. We propose a method of visualizing indirect effects by means of plotting model predictions of an outcome in the presence of exposure and mediator variables. We demonstrate the method through simulations and apply them to a real-world example involving Tree Swallows (Tachycineta bicolor) and their obligatory hematophagous ectoparasites, Protocalliphora spp. bird blowflies. The simple procedure using commonplace software should prove instrumental to visualize and interpret relationships among variables involved in ecological mechanisms and can be seamlessly integrated to analysts’ workflows.
This is the link towards the preprint of our article describing the method on Biorxiv.
This is the link to access and download the data used in the case study.
We use simulations to display the method with a simple use case in the Simulations tab. In the Blowfly Case Study tab, we show how to use the visualization method in the case of real world data and models in which the predictor variables have been scaled. This adds a subtle layer of complexity to the procedure but the code should help overcome this. Although not displayed in the publication, we have collaborated with Kallan Crémel to implement the method in cases where there are multiple mediators and interactions involved. This case study involving Bighorn Sheep can be found here.